Surviving a Cold Snap

by Joshua Robertson | Apr 9, 2021 | Research | 3 comments

15 minute read –
This is Part 3 of a 4 part series by guest author and ecologist, Joshua Robertson on how wildlife at the Yukon Wildlife Preserve stays warm (thermoregulates) in the winter. Read Part 1: Staying Warm in the Yukon and Part 2: Winter Heat Losses.

Preface

A few weeks ago, my partner and I had the beautiful fortune to welcome a baby into our family. For me (and my partner), the birth of this baby has meant stepping into the joyous and mystifying waters of parenthood for the very first time. Quite simply, we’re exhilarated. And like most first-time parents, we’re also, perhaps, a touch naive. Despite months of preparative reading and numerous discussions with other early parents, hardly a few hours had passed after his birth when questions began to percolate. How long should feedings last? Is co-sleeping preferable to sleeping separately? And the question most influenced by my career biases: how can we tell if our baby is sufficiently warm, or overheating?

Josh standing outside in snow with his new baby.
Upon realising the absolute dependence of our child on external help, the last of these questions noticeably shook me. For many years, I had viewed thermoregulation through an admittedly narrow lens. I contextualised the costs of warming and cooling in endotherms as manageable. True, I had acknowledged that such costs were often substantial, but I also coloured this acknowledgement with an all-too-human optimism bias. For example, crossbills can spend enormous amounts of energy on warming in the winter (often doubling their energy expenditure from summer to winter), but we still see crossbills persisting regularly through the worst of the season. So, my subconscious told me, why not ignore the situations where managing costs of warming isn’t possible?
Curiously, facing the decision of how to clothe our child allowed me to temporarily silence certain optimism biases. The costs of clothing him improperly, and thus challenging his capacity to thermoregulate, were simply too large to ignore; they could mean losing him. To me, this was a rather disquieting thought. Yet the lethal toll of poor thermoregulation is what all warm-blooded animals (or “endotherms”) must face, and have faced, since their evolution millions of years ago. (Of course, a similar toll can apply to many cold-blooded animals, or “ectotherms”, that rely on thermoregulatory behaviours, such as sun-bathing, to survive). How equally disquieting!
Photo of crossbill foraging.
But why stew on such bleak thoughts at all? Why begin our discussion in this way? Well, in my opinion, doing so leads us to two interesting and useful conclusions:

  1. Extreme cold and extreme heat for many animals can be, and often is, a real threat to their survival, and,
  2. Facing this threat has paved the way for the evolution of some truly spectacular thermoregulatory strategies and capacities.

Evolution can be a brutal, yet wonderful process.

Thermoregulating in a Cold Snap

In this post, we’ll be taking a look at how certain endotherms at the Yukon Wildlife Preserve are challenged by cold snaps that would undoubtedly prove lethal to an unprepared human. In doing so, we’ll also take a look at how these animals compare to one another in their thermoregulatory strategies and capacities. If you’re like me, I think you’ll find the conclusions intriguing. So let’s put aside the sombre tone and see what findings emerge.

Now if you happened to read my last post (Winter Heat Losses), you’ll recall that to understand the costs of thermoregulation across certain Yukon-dwellers, Jake Paleczny (our Executive Director) and myself braved the January cold to capture infrared thermographic images of animals cared for at the Yukon Wildlife Preserve. With these images, we were able to quantify just how much heat animals were losing to the environment, and thereafter, estimate how much energy these animals would need to spend to compensate for their heat-loss. In doing so, we discovered that at -12°C, the average Moose might spend slightly less than one McDonald’s cheeseburger worth of energy on warming across a 4 hour period. By contrast, the average Thinhorn Sheep (or “Dall Sheep”) might spend about one and three quarters cheeseburgers in similar circumstances, and the average Muskox, around negative one half of a cheeseburger. And where did Jake fit in? We estimated his expenditure to be about one cheeseburger, despite wearing full winter gear. To top these findings off, we also discovered that if we were to scale the costs of warming according to usual daily energy expenditure in each animal, Jake would probably be spending more than each of the other observed animals on warming. All together, I’d say that these are some interesting findings. But remember, our observations were made at -12°C – hardly a real thermal challenge for Yukon natives (particularly for those in Old Crow, where record lows have reached nearly -60°C).
So what happens to costs of thermoregulation when a true challenge strikes? For example, what do costs of warming look like when temperatures fall below -30°C, as they did in Whitehorse during early February?  Below, I’ll do my best to answer that question. But first, I think it’s important that I remove some turbidity from our discussion. In our past discussion, my estimates of cheeseburger-use across animals were about as opaque as the Liard River. Indeed, some of you were likely wondering how such estimates were made at all, and how they might be prone to error. These are good things to wonder. So how were our estimates made after all? If the answer to that question doesn’t interest you, I’d recommend you skip a few paragraphs to get to our final findings below. For those who are interested, the next few paragraphs detail the path that myself (and other thermal biologists) would typically walk to understand how an animal is interacting with, and adjusting to, their thermal environment. A detailed description can also be found in one of my recent publications about black-capped chickadees.

Estimating the Cost of Thermoregulation

Before I begin, I’ll be honest and state that the manner by which I’ve estimated costs of thermoregulation may seem more convoluted than necessary. Actually, in some ways, it probably is more convoluted than necessary. But it does reflect standard practice in the field of thermal biology (for good reason), and it does provide opportunities to paint a fuller picture of what is happening across an animal at the time that an infra-red thermographic picture was captured. With that in mind let’s begin.

Thermal image of Thinhorn Sheep at 34c below 0c. Scale is in rads.
Let’s first return to an image of a handsome male Thinhorn Sheep, captured at -12°C (shown above). First, have a look at the scale bar on the top right of the image. You’ll notice that the range of values has changed substantially from those in our previous images. That’s because these values now represent the amount of infrared radiation (specifically, a subset of infrared radiation referred to as “long-wave” radiation) that the camera has detected at each pixel. Notice that these values are not in degrees Celsius, nor are they in any other unit of temperature. Rather, they represent units of energy per area (possibly kilowatts per meter squared, or “kW/m2”, however, the actual units are not disclosed by the camera producer). Remember, heat has the capacity to do work, so it can be measured in units of energy.  These values in kW/m2 are precisely what our infrared thermographic camera gives us – the next step is to figure out what they really mean for a specific object (our sheep).
Line drawing of energy sources and losses when taking thermal images.
To make sense of our energy measurements, we first need to acknowledge that the infra-red radiation striking our camera can come from a number of sources: our sheep, the molecules in the atmosphere, and, of course, the sun (either travelling directly to our camera, or by reflection from other objects like the surrounding snow or the sheep’s pelage). Furthermore, some of the infra-red radiation travelling toward our camera can, and will be, absorbed by molecules in the air (like water vapour) before reaching us. This means that if we wish to make any inferences about heat-loss from our sheep (indicated by the teal arrow in the diagram above), we’ll need to control for the heat produced by the sun and the environment, the amount of water vapour in the air, and the reflective capacity of the sheep’s fur. Thankfully, we can make pretty good guesses at these factors by looking at the temperature and humidity at the time we captured our image, and by drawing on measurements of fur reflectance in other animals. Once we’ve controlled for these values and followed what’s called “Planck’s Law”, we’re left with the beautiful image below.
Thermal image of Thinhorn Sheep at 12c below 0c. Scale is in degrees.
Notice that the values are now in units of temperature? A pretty good step forward!

Now what about the costs of heat-loss? To estimate this value, a little more calculation will be required. First, you may recall from high-school physics class that heat can be lost in any of three ways: conduction, convection, and radiation. The first method describes the transfer of heat from a solid object to another solid object (think of your lap after being warmed by a cat). By contrast, the other two methods described transfer of heat from a solid to a fluid, and to empty space (think of your hands after warming them by the fire). Estimating heat-loss by each method requires the use of several biophysical theories and equations (nicely summarised by Dominic McCafferty and others), but there are a few common and convenient threads running through them. For example, calculating heat-loss by each method requires knowledge of:

  1. The temperature differential; that is, how big the temperature difference is between the warm object and the “thing” that it is losing heat to,
  2. Resistance; that is, how much an object opposes heat flow (this value factors into properties of an object called the “heat transfer coefficient”, or “thermal conductivity”), and,
  3. Surface area; that is, how much space there is for heat to transfer between a solid object and the “things” it is in contact with.

If we think about it breifly, these values, or parameters, are actually quite intuitive. Big temperature differentials, like those Jake experienced between his body and the air, mean big heat losses. Similarly, low resistance and a large surface area, like those experienced by our large and poorly-insulated moose, also mean big heat losses. For our calculations of heat-loss, we can make strong guesses at resistance and temperature differential values by looking at previous studies on heat emission from biological tissues, and by – you guessed it – using the temperature values that we obtained from our thermal images.

But what about surface area? Now here’s where things can turn sour. Measuring the surface area of an animal can be extremely difficult, especially since the body shape of most animals hardly represents a simple geometrical shape. (As a quick thought experiment, imagine measuring the surface area of a human ear). This, then, is where error around our cheeseburger estimates mostly come in. Why? Because the best we can do is approximate with some simple shapes that are drawn to match known animal measurements – like in the image below.
Line drawing showing a sheep being represented by simple shapes for surface area estimation.
These approximations work, but aren’t perfect; that is, you could probably guess that the figure on the right is a sheep, but it certainly wouldn’t pass as one to another sheep (although if we were talking about poultry, the story might be different). With that in mind, I wouldn’t recommend betting a limb on our cheeseburger estimates. While our estimates likely do draw close to the true values we’d see in nature, they will, admittedly, stray by some moderate degree. This source of error is one that has plagued thermal biologists for quite some time, and even the more complex models still usually represent mammals as furry tubes (for example, see Porter and Kearney, 2009)
Now that we’ve cleared the Liard, let’s get back to heat-loss at the preserve during our cold snap.  Remember, we’re looking at how animals respond to temperatures below -30°C. Care to guess what this means for our temperature differentials?

Moose and Muskox at -34°c

To begin, let’s revisit a few candidates from last week: the Moose and Muskox (depicted below). Sadly, we weren’t able to capture any images of the Thinhorn Sheep during the cold snap, so we’ll have to leave that species to our imagination for today.
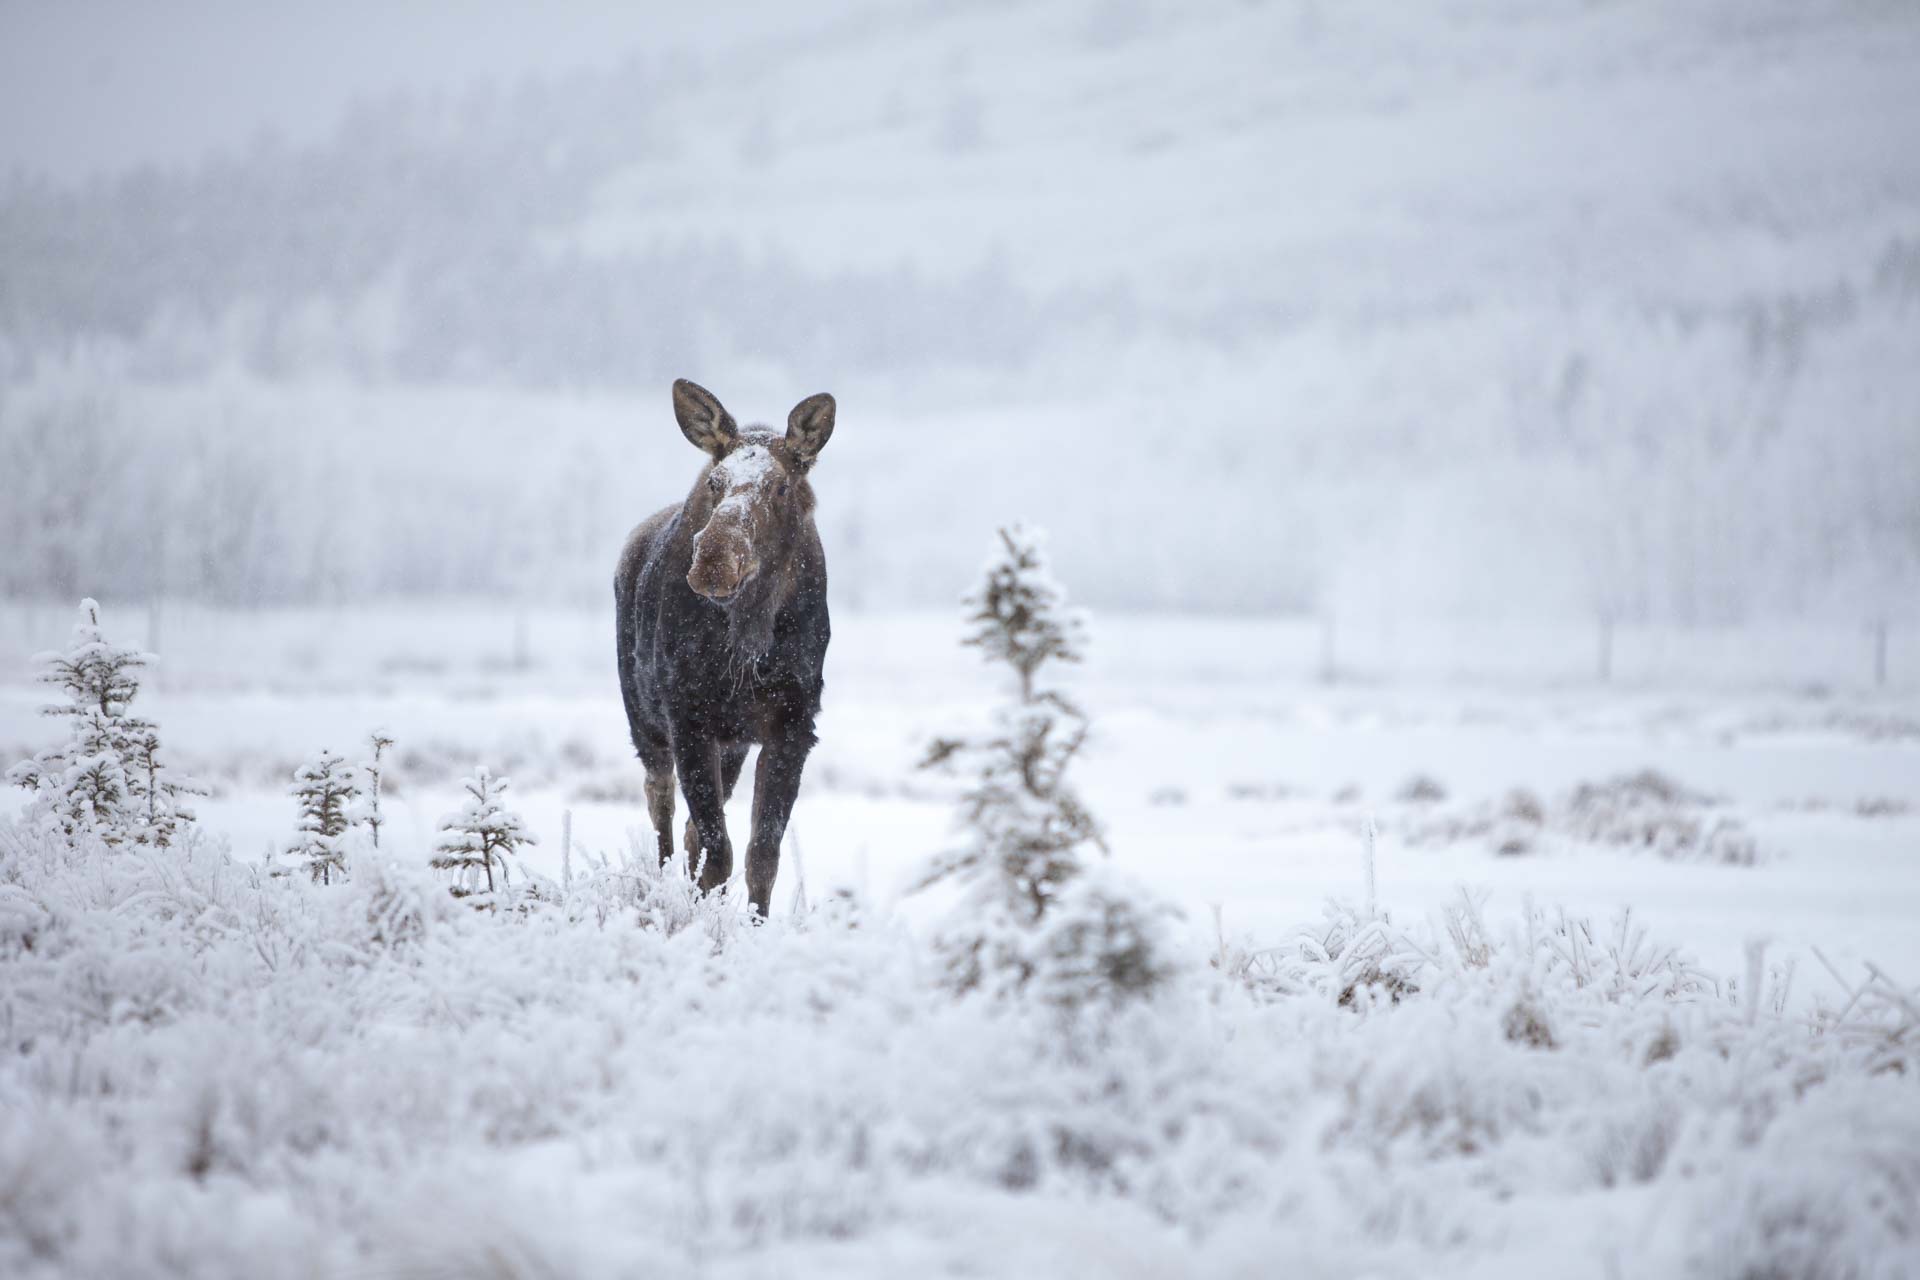
If you recall from our previous discussion, our Moose and Muskox spent around one, and negative one-half cheeseburgers worth of energy on keeping warm at -12°C across four hours. So what does their expenditure look like during a true cold snap?
For the Moose, quite a bit different. At -34°C, our imaged Moose is likely spending about two whole  cheeseburgers on maintaining a constant body temperature across a four hour period. That’s a little over a two-fold increase from their expenditure at -12°C. As you can imagine, two whole cheeseburgers is quite a bit of energy to spend on warming, particularly when that energy is sourced from sparse patches of foliage. In nearby Alaska, Moose largely subsist on the twigs of various willow species throughout the winter months, including Feltleaf Willow, Diamondleaf Willow, and Greyleaf Willow (see Risenhoover, 1989). Surprisingly, previous studies have shown that Moose are able to extract a fairly high amount of energy from the tissue of these plants: approximately 5 calories/gram, or about the calorie density of mayonnaise for us humans. Nevertheless, at this calorie density, compensating for the energy needed to keep warm on a -34°C day would require our Moose to consume over half of a kilogram more plant tissue than usual. To put this value into perspective, that’s about all of the willow twigs in a 20 – 65 square meter area of suitable browsing habitat (which can be patchy in some places).
Line drawing showing a sheep being represented by simple shapes for surface area estimation.
If temperatures this low persisted for a long period of time (say, weeks), and suitable browse can’t be found, they could represent a very real threat to a Moose’s survivorship – particularly if energy is also being spent on evading possible predators. As we’ll see shortly, however, the degree of this threat actually pales in comparison to that faced by other, less equipped animals. But for now, what about our Muskox?
Amazingly, the amount of energy spent on warming in Muskox at -12 and -34°C remains virtually unchanged. In fact, our estimate suggests that our imaged Muskox is probably spending little to no extra energy on warming at -34°C, relative to average energy expenditure! If you find this result surprising (as I have), you’re not alone. In 2009, Munn and others obtained very similar results when monitoring Muskox in Alaska, and like us, express their appreciation. They quote:

Surface temperatures of muskoxen were only 5°C above ambient temperatures at -30°C, a testament to the substantial insulation provided by their coat…”

Okay, appreciation might be a strong word, but the above quote is probably the closest one can get to appreciation in terse scientific language.

Caribou and Arctic Fox: Cold Weather Specialists

So what about some other Yukon residents? And what about Jake? Next, let’s have a look at few other winter specialists: the Woodland Caribou and Arctic Fox (shown in the images below).

From a quick glance at the image of our Caribou (on the left), we can already guess that thermoregulatory expenditure is this male is probably going to fall below that of the Moose. This makes sense, given that the Caribou “species complex” (that is, the aggregation of all Caribou variants) regularly ranges further north than the Moose. Moreover, Moose are thought to be relatively newer residents of the cooler Canadian north than Caribou, with Caribou arriving on the scene about 1.6 million years ago (closer to the beginning of the last ice age), and Moose about 15 thousand years ago (closer to the end of the last ice age; see Hundertmark and others, 2002, and Weckwork and others, 2012, for further reading). But just how much energy-savings do these advantages lead to for our Caribou? Surprisingly quite a bit! In fact, our calculations suggest that the imaged Caribou seems little influenced by -34°C temperatures, with expenditure toward warming reaching only one half of a cheeseburger across 4 hours of exposure. The most impressive part about this figure is that, if we extrapolate from studies of calves or adults of a closely related subspecies,  metabolic heat production in Caribou is actually lower in the winter than it is in the summer (see McEwen and Whitehead, 1970, and Nilssen and others, 1984). If you’re wondering how such low expenditure on warming could be achieved in this species, stick around for our final discussion post. There, I’ll do my best to answer how and why we see such variations in thermoregulatory expenditure across species.
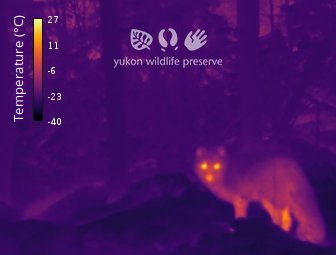
And what about our Arctic Fox? Interestingly, estimating thermoregulatory expenditure in this species isn’t easy – particularly when compared with our Caribou and Muskox. As we can see from our thermographic image above, the majority of heat lost to the environment in this individual occurs at the legs. In the field of thermal biology, such sites of exacerbated heat-loss are often referred to as “thermal windows”. To help “close” these thermal windows and reduce their loss of energy in cold environments, Arctic Foxes commonly enwrap their legs with their large and well-insulated tail.
During our cold-snap, using this type of enwrapment could result in a nearly 7-fold reduction in heat-loss across a four hour period. This means that the duration of time in which our Fox remained huddled will have a substantial influence on true expenditure toward warming. Sadly, without some chilly and prolonged observations, time spent huddling isn’t easy to estimate. But, to ensure that we’re drawing a somewhat realistic estimate of prolonged heat-loss in our Fox, I’ve assumed that half of its time was spent standing, and half of its time was spent huddling. Bearing that in mind, expenditure on warming in this individual amounts to… Only one human-sized bite (or one twentieth) of a cheeseburger across our 4 hour period! If we ignore tail-wrapping behaviour, we’re looking at approximately one third of a cheeseburger. A useful tail huh?

Bison and Mule Deer: Non-specialists?

Finally, to help us contextualize thermoregulatory expenditure in our specialists, I think it will be useful to compare their performance during our cold snap against some local “non-specialists”. (Note that I quote non-specialists here because when compared to an Ocelot or Marsh Widowbird, the below species are truly quite efficient. Nevertheless, the Yukon largely represents the northern end of each species’ range). Below are two infra-red thermographic images of a few conspicuous species meeting this criteria: the Wood Bison (left) and Mule Deer (right).

The Bison species complex is certainly not naive to colder climates. Rather, current genetic studies suggest that they’ve likely been hanging around northern North America for about 150 thousand years (see Froese and others, 2017). The curious problem with this species complex, however, is that the most northerly-living, and probably the most cold-adapted species grouping (the Wood Bison), suffered considerably declines from over-hunting in the past 5 centuries. By the late 1800s, population size estimates of the Wood Bison fell dangerously to approximately 300 remaining individuals. To help revitalize the population of Wood Bison, several individuals from the more southerly-dwelling species grouping (the “Plains Bison”) were moved north to the Wood Bison range, therefore increasing genetic diversity and the size of the breeding population. Thankfully, this revitalization effort was a spectacular success. A consequence of this effort, however, may have been the loss or dilution of certain cold-adapted traits. So, despite many years in North America, we might expect that efficiency of warming in the Wood Bison probably falls slightly short of other large and sympatric mammals. As for the Mule Deer, we can certainly expect that efficiency of warming falls short of other large mammals. Unlike the Caribou, Moose, and even Bison, this species is actually more adapted to warmer climates, and likely arrived in the Yukon as recently as 50 years ago owing to a warming climate (see Boonstra and others, 2018).
For the Wood Bison, our estimates suggest that expenditure on warming likely sits around two and a half cheeseburgers in our four hour period. And the Mule Deer? Approximately one and a half cheeseburgers! Confusing? See below.
Now, for the sake of time, let’s cut to the chase. Where does the cost of warming in our cold-snap sit for our non-specialists compared to our specialists?

Comparing Specialists and Non-specialists

Overall, these values do seem to suggest higher expenditure in our non-specialists when compared with our specialists. If we wish to make meaningful conclusions from these values, however, we’ll need to make one important adjustment: scale our estimates of thermoregulatory expenditure against usual daily expenditure (as we discussed in our last last discussion). So far, we’ve quantified the absolute amount of energy each of our observed animals would need to spend to maintain a constant body temperature in the cold. But each of these animals will already be consuming vastly different quantities of stored energy. So by comparing these absolute values among animals, we’re effectively comparing bananas to shoes (or Whitehorse to Destruction Bay); they’re incomparable. To solve this problem, we’ll need to look at relative expenditure toward warming. To follow what I mean here, take a look at the diagram below.
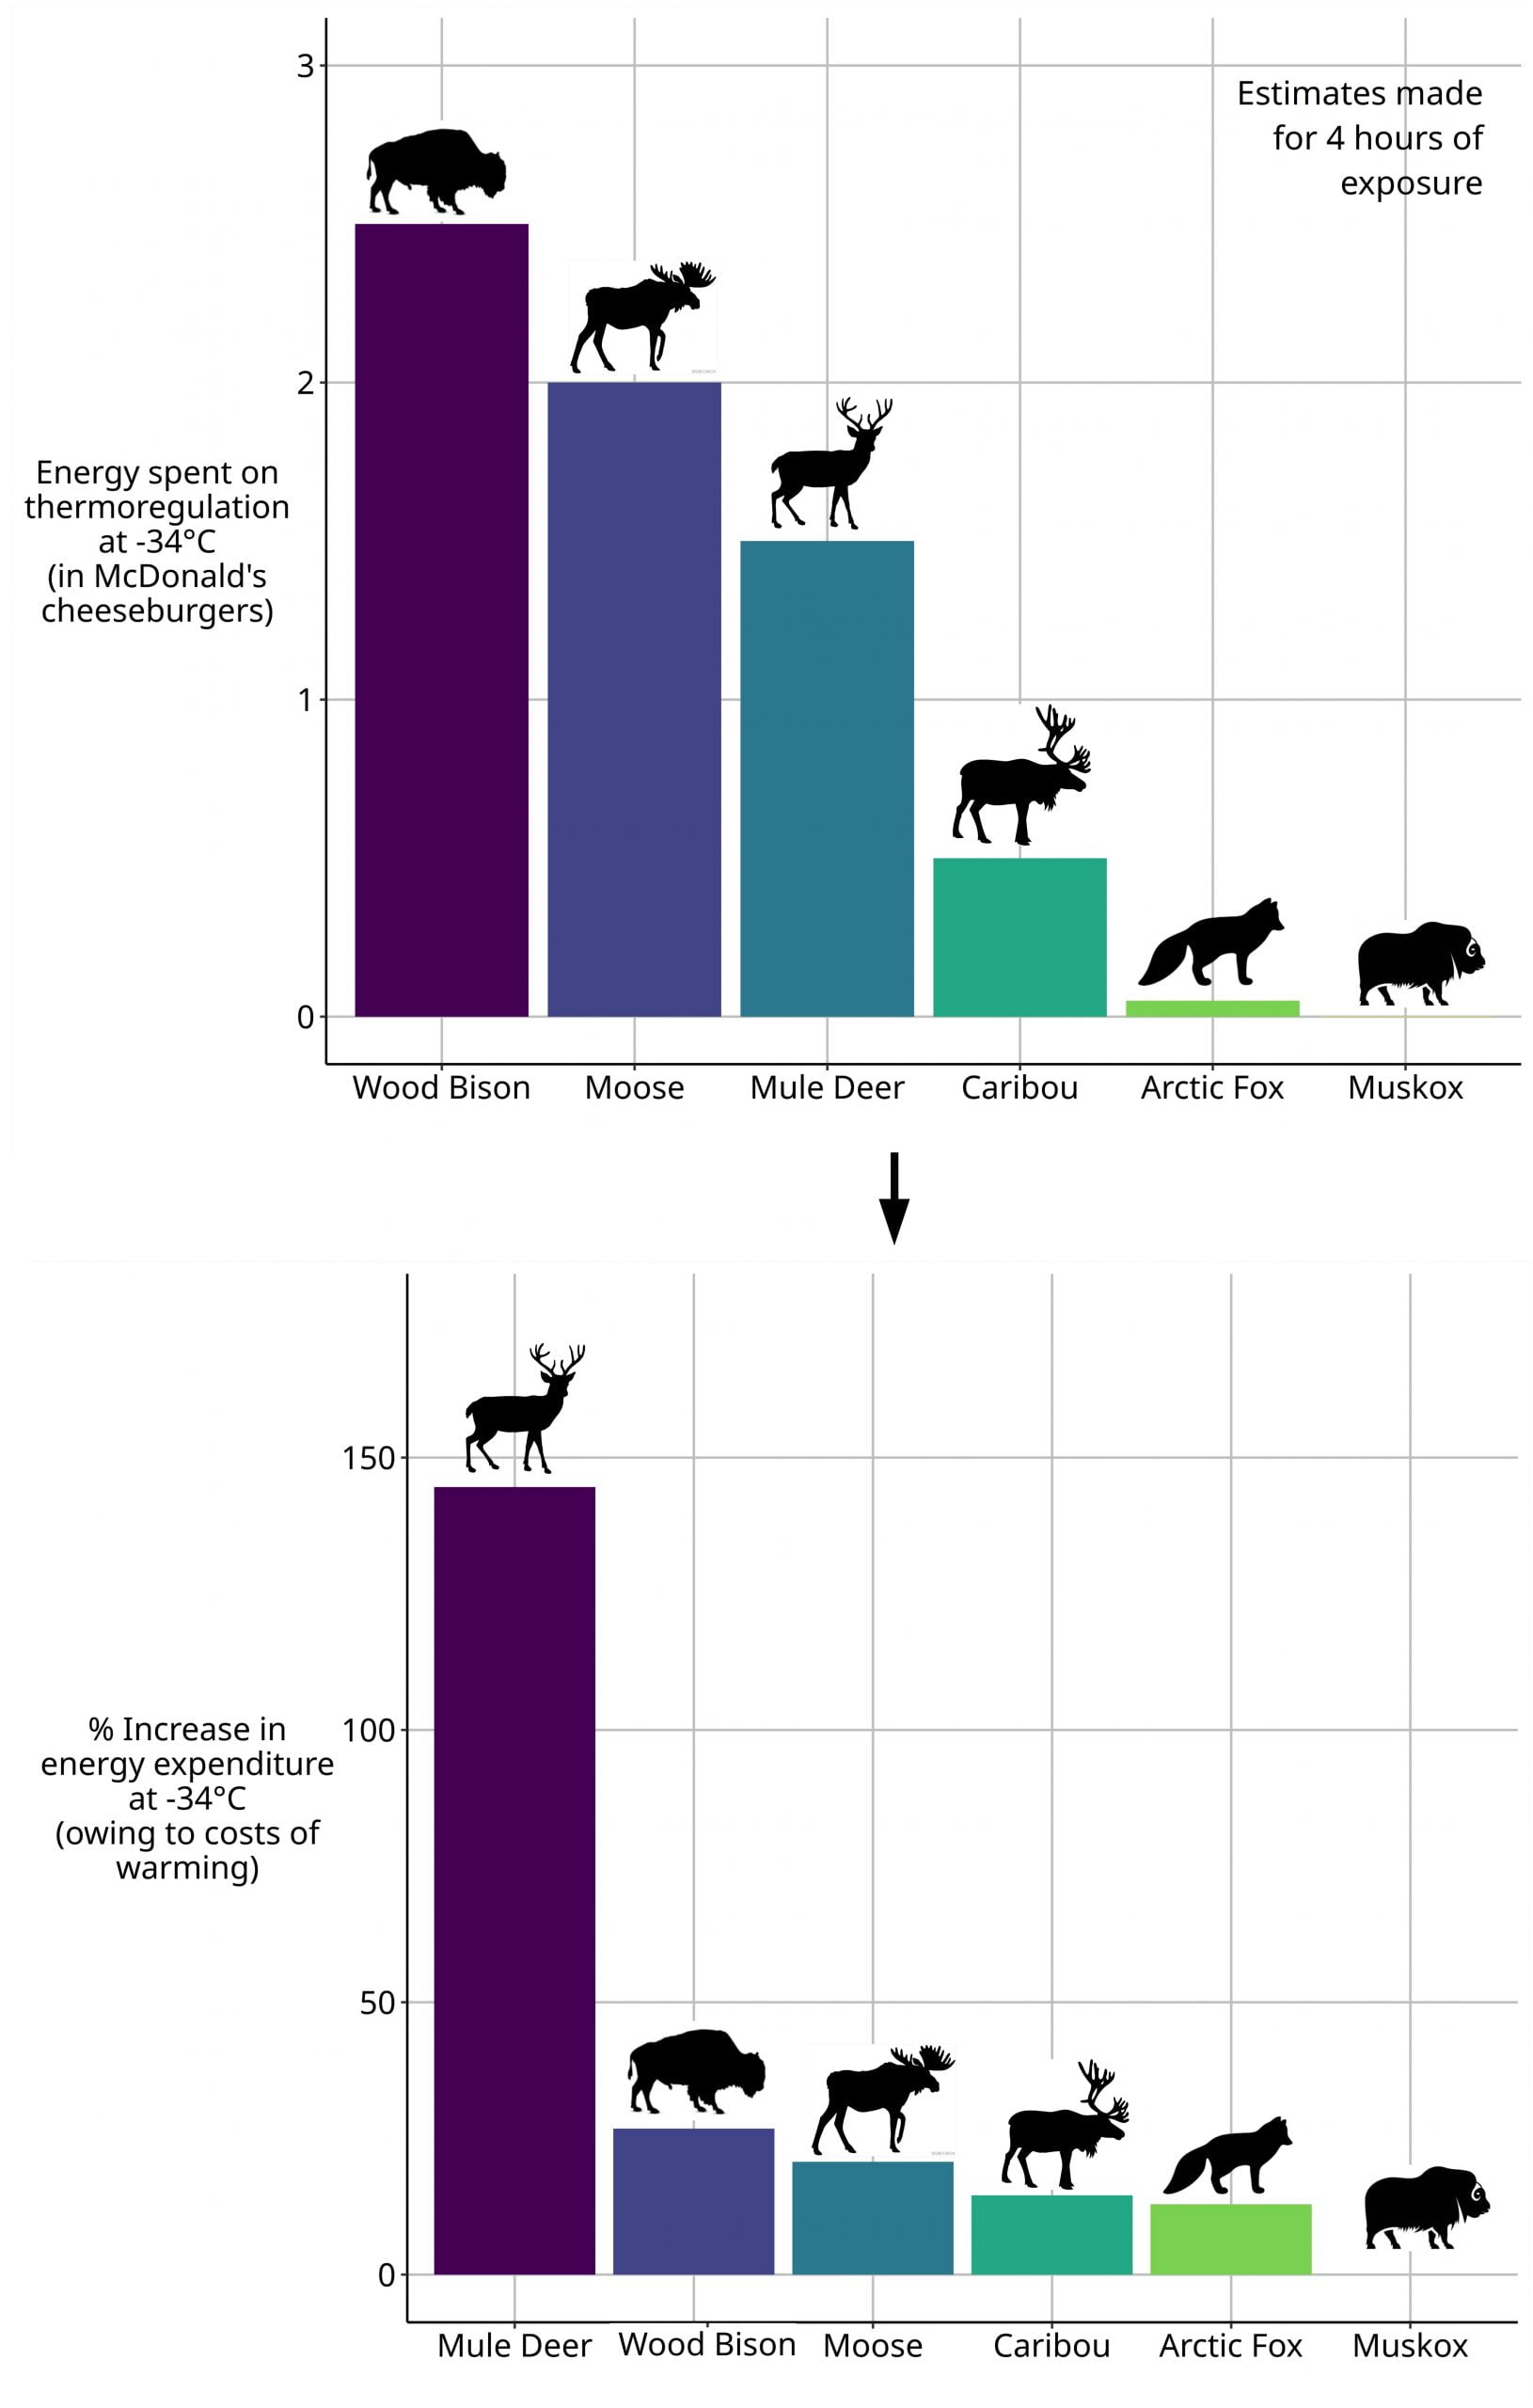
Two bar graphs showing absolute and relative energy use of 6 species of Yukon wildlife.
In the upper plot, we can see our cheeseburger estimates depicted in plot form. From this plot, we might be led to believe that the Wood Bison wins our award of the least efficient thermoregulator of our observed animals. Congratulations Wood Bison! Additionally, this plot may also lead us to believe that expenditure toward thermoregulation in cold-snaps doesn’t vary that much across Yukon mammals. However, once we represent expenditure toward thermoregulation as a percent increase in usual energy expenditure (the lower plot above), a new and more accurate picture begins to emerge. Here, we can see that relative expenditure toward thermoregulation does vary quite significantly across Yukon animals. Furthermore, we can also see that our least efficient thermoregulator is truly the Mule Deer, not the Wood Bison. In fact, compensating for heat loss during our cold snap likely required our Wood Bison to increase it’s energy expenditure by only 24%, while a similar compensation in our Mule Deer likely required a 135% increase in energy expenditure. To be clear, that’s an over-doubling of energy expenditure in the Mule Deer during a cold snap! Notably, long-lasting cold spells of this intensity could lead to serious survival risks for this species.
But we’re missing something in our plots and discussion: where do we humans fit in?

But what about us humans?

From experience, we know that even in full winter clothing, -34°C can be very uncomfortable. And using our imagination, we can also assume that removing our winter gear in such cold weather is a dangerous endeavour. So what does this discomfort and danger mean for our energy expenditure?

To answer that question: enter Jake. In the left image above, we can see Jake kneeling beside a resident male Muskox while donning winter attire suitable for the cold-snap. Even in such winter attire, we can see that Jake is almost certainly losing more heat to the environment than the adjacent Muskox. In the right image, our Muskox has been replaced with a resident female Caribou and Jake has bravely shed his outer jacket. Need I comment on relative expenditure? But, beyond our Muskox and Caribou, how does he stack up against our other observed species?
Bar graph showing relative energy use of wildlife and humans in Yukon.
Thought the Mule Deer was inefficient? As I mentioned before, evolution can be a wonderful process. Clearly, generations of outdoor living can lead to some impressive capacities to tolerate extreme weather. In my next and last post, we’ll discuss just how such capacities are achieved, and what they mean for species persistence in a rapidly changing world. But for now, I’ll leave you with a few pieces of information to think about:

  1. Although eating plenty of cheeseburgers might improve one’s comfort at -34°C, doing so wont keep hypothermia at bay if one remains unclothed. Rather, the extent to which any animal can elevate it’s metabolic rate is limited, regardless of how much food they eat. In humans, that limit seems to fall fairly close to the increase we might have seen in Jake if he were able to maintain a constant body temperature without his jacket. However, that limit appears only to be reached in extreme and long-lasting sporting competitions, such as the Tour de France.
  2. Adaptations to persist in cold have undoubtedly been helpful for surviving winters in the Yukon, but there is a second side to this coin: a loss of tolerance to warm weather and a bigger battle to face when coping with climate change.

Our Muskox and Arctic Fox might have an interesting future ahead of them.

Joshua Robertson

Joshua Robertson

Behavioural and Physiological Ecologist

Joshua is a behavioural and physiological ecologist currently living on Cape Breton Island, Nova Scotia. During his PhD at Trent University, Joshua sought to understand how small birds can cope with the high costs of body temperature regulation when challenged with other environmental stressors (such as human and predator exposure). He is currently extending the research to better understand energy management strategies in warm-blood animals.

Explore by Category

Explore by Author

3 Comments

  1. Christopher

    Very interesting article. Clearly, there have been significant changes in Yukon’s Bison population over the past 12,000 years. It would be very interesting to try and calculate the differences between modern bison and the Steppe Bison which thrived here during the last glaciation, and were probably, along with horses, the most successful large animal species in terms of sheer numbers, on the Mammoth Steppe. I would love to see an estimate of cold weather energy expenditure for extinct megafaunal species such as Mammoth, Steppe Bison, Giant Beaver, etc. Also, how about that other endangered survivor of colder times, The Saiga Antelope? Otherwise, I really enjoyed this article.

    Reply
  2. Eugene Morin

    Dear Joshua, I’m an archaeologist working on the subsistence exploitation of caribou/reindeer in the past with a focus on physiology, among other things. My colleagues and I are looking for high-resolution thermographs (possibly with a scale) for a publication that focuses on changes in fatty acid composition in caribou/reindeer (in the body, changes in fatty acid composition seems to be influenced by surface body temperature, which explains why we are interested in these thermographs). If you happen to have such photographs that you would be willing to share, please let us know.

    Best,
    Eugene

    Reply
  3. Doug Heard

    Do you have anything to suggest about the possibility of using thermal imagery to differentiate body condition among individual caribou, i.e., do areas of the body of skinny caribou block less heat/show up warmer than fat ones? I plan on trying thermal imagery out in the next week or so, but perhaps you could give me some suggestions of things to try. The caribou I study are conditioned to my presence so I can approach to within a few meters; all ages both sexes are present.

    Reply

Submit a Comment

Your email address will not be published. Required fields are marked *